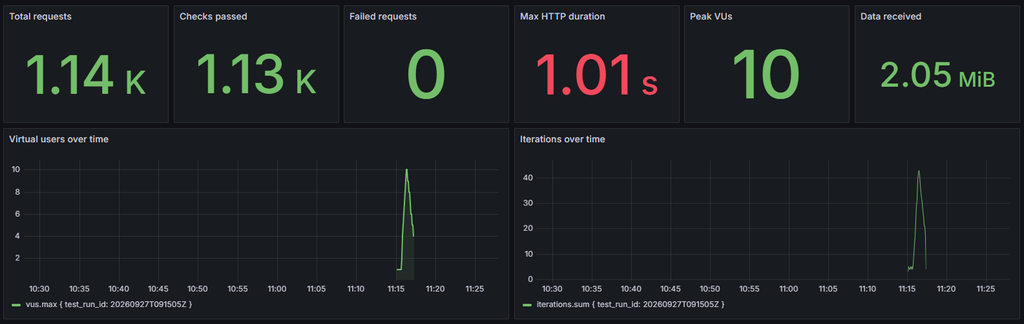
Mi is történt? Ismét a semmiből kezdtem, megkértem a Copilot-ot, hogy csináljon egy project-et. El is készült, futott, de a riportolásával nem voltam elégedett. Megkérdeztem, hogy mit ajánl rá, ő elsőre a Grafana felhős szolgáltatását ajánlotta, de mivel lokálból akartam megoldani, így kiegyeztünk a Grafana lokális verziójával. Telepített Grafanát, Dockert, InfluxDB-t. Még a Grafana dashboard-ot is vele csináltattam meg. Még koránt sincs kész, de majd megfelelő Token birtoklásával orvosolni fogom.
Teszt kód:
import http from 'k6/http';
import { check, sleep } from 'k6';

export const options = {
  stages: [
    { duration: '40s', target: 2 },
    { duration: '35s', target: 10 },
    { duration: '60s', target: 3 },
  ],
  thresholds: {
    http_req_failed: ['rate<0.01'],
    http_req_duration: ['p(95)<500'],
  },
};

const baseUrl = __ENV.BASE_URL || 'https://test.k6.io';

export default function () {
  const response = http.get(baseUrl);

  check(response, {
    'status is 200': (result) => result.status === 200,
    'response is HTML': (result) => result.headers['Content-Type'].includes('text/html'),
  });
}
Futtatás:
D:\Repositories\ai-k6> npm run test:grafana

> ai-k6@1.0.0 test:grafana
> npm run build && node scripts/run-grafana.mjs


> ai-k6@1.0.0 build
> esbuild src/smoke.ts --bundle --format=esm --platform=neutral --external:k6 --external:k6/http --outfile=dist/smoke.js


  dist\smoke.js  670b

Done in 4ms

         /\      Grafana   /‾‾/
    /\  /  \     |\  __   /  /
   /  \/    \    | |/ /  /   ‾‾\
  /          \   |   (  |  (‾)  |
 / __________ \  |_|\_\  \_____/


     execution: local
        script: dist/smoke.js
        output: InfluxDBv1 (http://localhost:8086)

     scenarios: (100.00%) 1 scenario, 10 max VUs, 2m45s max duration (incl. graceful stop):
              * default: Up to 10 looping VUs for 2m15s over 3 stages (gracefulRampDown: 30s, gracefulStop: 30s)


  █ THRESHOLDS

    http_req_duration
    ✓ 'p(95)<500' p(95)=135.05ms

    http_req_failed
    ✓ 'rate<0.01' rate=0.00%


  █ TOTAL RESULTS

    checks_total.......: 1138    8.391855/s
    checks_succeeded...: 100.00% 1138 out of 1138
    checks_failed......: 0.00%   0 out of 1138

    ✓ status is 200
    ✓ response is HTML

    HTTP
    http_req_duration..............: avg=72.84ms min=184µs med=114.54ms max=1s    p(90)=132.88ms p(95)=135.05ms
      { expected_response:true }...: avg=72.84ms min=184µs med=114.54ms max=1s    p(90)=132.88ms p(95)=135.05ms
    http_req_failed................: 0.00%  0 out of 1138
    http_reqs......................: 1138   8.391855/s

    EXECUTION
    iteration_duration.............: avg=1.15s   min=1.12s med=1.14s    max=2.02s p(90)=1.15s    p(95)=1.16s
    iterations.....................: 569    4.195928/s
    vus............................: 4      min=1         max=10
    vus_max........................: 10     min=10        max=10

    NETWORK
    data_received..................: 2.2 MB 16 kB/s
    data_sent......................: 86 kB  637 B/s


running (2m15.6s), 00/10 VUs, 569 complete and 0 interrupted iterations
default ✓ [======================================] 00/10 VUs  2m15s
PS D:\Repositories\ai-k6>
Grafana
Vélemény, hozzászólás?
Hozzászólás küldéséhez be kell jelentkezni.